For a lot of people, working with statistical data used to feel hard and take a lot of time. But thanks to the growth of Information Technology (IT), analyzing data is now easier and much faster. These days, most computers come with spreadsheet tools like Microsoft Excel, or you can install more advanced data analysis software like SPSS or MINITAB.
With Excel, you can easily calculate averages, run simple linear regression, or create charts and histograms. For basic data analysis needs, Excel usually does the job. But if you need to dig into more complex data, software like SPSS, MINITAB, or STATISTICA gives you powerful tools to go deeper and get more accurate insights. Figure 1 below shows the interface of some of these popular statistical software programs.

Figure 1. Statistical Analysis Software Examples
Statistical software isn’t limited to just the four programs mentioned above. Still, when people hear the term “statistical software”, the first name that often comes to mind is SPSS. Although I’m not very familiar with SPSS myself, it’s widely used in universities as a starting point for learning statistics and data analysis tools.
Getting to Know SPSS
SPSS (originally Statistical Package for the Social Sciences) was created back in 1968 by Norman H. Nie, C. Hadlai (Tex) Hull, and Dale H. Bent at Stanford University. At first, it was built specifically for social science research, which is how it got its name. But as time went on and the software’s capabilities expanded, SPSS changed its name to Statistical Product and Service Solutions.
Right now, I’m using SPSS 14.0 Evaluation Version, which was released on September 5, 2005. Even though it’s an older version, most of its main functions are still pretty similar to the newer ones—perfect for learning how to do basic statistical analysis.
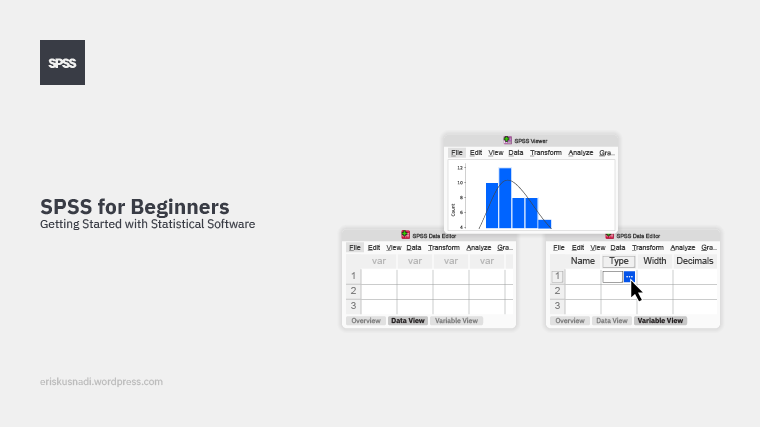
When you open SPSS version 14, you will see two main windows:
- SPSS Data Editor
- SPSS Viewer

Figure 2. SPSS Data Editor & SPSS Viewer
The SPSS Data Editor is where you input and manage your data, and where you run analysis commands. Meanwhile, the SPSS Viewer shows you the results—things like charts, tables, and summaries of your statistical analysis.
If you’re just getting started with SPSS, the most important place to focus on is the SPSS Data Editor window. It’s where everything begins—data entry, organizing variables, and launching your first analyses.
SPSS Data Editor Guide: Data View & Variable View Explained
If you’re working with SPSS for data analysis, one of the first things you’ll see is the SPSS Data Editor window. This window has two main tabs:
- Data View – where you actually input or see your raw data.
- Variable View – where you define your variables and set their properties.
Let’s take a look at what each tab does and why they’re important.
A. Data View: Where the Data Lives
Data View is kind of like a spreadsheet where you enter your dataset (see Figure 3). It shows the data in a grid layout — rows are the individual cases from your research, and columns are the variables you are collecting. On the top bar of the software interface, you will find menus such as File, Edit, View, Windows, and Help, similar to the common menus found in other Windows-based applications.
Key Features of Data View:
- Allows you to enter or view raw data, making it easier to inspect and understand your dataset.
- Each row represents an individual case or observation (e.g., a survey respondent — if 100 people respond, there will be 100 rows).
- Columns represent the variables in your dataset that are associated with each case. Each column corresponds to a variable you are collecting (e.g., age, gender, income).
- Displays value labels (e.g., “Male” or “Female” instead of just 1 or 2) for better readability.
- Features a user-friendly interface with familiar menus such as File, Edit, View, Data, Transform, Analyze, Graphs, and Utilities.
Main Menu Options in SPSS:
- Data: This menu helps you modify datasets—sort data, split files by criteria, merge files, and more.
- Transform: Here’s where you can do apply data transformation—compute variables, recode values to fit your needs, rank data, etc.
- Analyze: All your stats happen here—simple summaries (descriptive statistics), regression, correlation, nonparametric tests, and more.
- Graphs: Use this menu to make charts and graphs to visualize your results—create bar charts, histograms, scatter plots, pie charts, etc.
- Utilities: This one helps you view and manage variable details, file information, value labels, and other data settings.

Figure 3. Data View
B. Variable View: Setting Up Your Variables
Variable View is a tab sheet where you can define and edit the properties of each variable in your dataset. It shows a table in which each row represents a variable and includes information such as the variable name, type (numeric, string, date, etc.), width, decimals, label, and more.

Figure 4. Variable View
Here’s what each column means:
1. Name: Define the variable’s name.
Rules:
-
-
- Max 8 characters
- Must start with a letter
- No spaces or special characters like !, ?, *
- Must be unique
- Not case sensitive
-
2. Type: Set the data type (e.g., Numeric, String, Date).
By default, variables are Numeric with 8 digits and 2 decimals. Use the Variable Type dialog box to change type, width, or decimals.
In the Type column, just click the box next to the variable you want. A [ … ] button will show up. Click it, and the Variable Type dialog box will open.
![]()

Figure 5. Variable Type
3. Label: Add a descriptive label to explain the variable.
Example:
-
-
- Variable: product → Label: “Product Name“
- Variable: X → Label: “Demand“
- Variable: Y → Label: “Forecasted Demand“
-
4. Value: Assign labels to numeric codes (ideal for ordinal/categorical data).
Example:
-
-
-
- 1 = Male
- 2 = Female
-
-
Use the Value Labels dialog box to set this.

Figure 6. Value Labels
5. Missing: Identify missing data values using placeholders like 9 or 99.
This helps avoid inaccurate analysis results due to unrecorded data. Sometimes people don’t answer a question, don’t know the answer, or answer differently. If you don’t notice this, your results might not be correct. SPSS will then treat those values as missing in analysis (they won’t be included in means, regressions, etc.).

Figure 7. Missing Values
6. Columns: Specify column width. Max width is 255 characters for both string and numeric.
7. Align. Set data alignment in cells—Left, Right, or Center.
8. Measure. Define the level of measurement:
-
- Scale (Interval/Ratio)
- Nominal (Categorical without order)
- Ordinal (Categorical with order)
Getting comfy with Data View and Variable View means less time struggling and more time analyzing. Proper setup ensures your data is clean, organized, and ready for powerful stats and clear charts.
Wrap-Up
Whether you’re new to SPSS or just need a refresher, knowing how to navigate Data View and Variable View is a must. These tools help you manage your data smoothly and get the most accurate results out of your analysis.
